Computational environments in support of
K-6 Mathematics Core Curriculum of
New York State.
Introduction
New York State Education Department suggests that the appropriate use of computing technology can be a valuable part of K-6 mathematics program. This reflects a general view on technology as a crucial factor in restructuring education. In particular, using technology in the teaching of mathematics facilitates the development of a dynamic perspective on mathematics, and presents it as an exploratory science built on progressively connected ideas and mutually related concepts. As far as software-enabled pedagogy is concerned, one may recognize a shift in emphasis from task-bounded software as teaching and learning tools to a broader use of general-purpose software. For example, computer spreadsheet is generic software that seems to become more and more available in schools, colleges, and universities.
The Principles and Standards for School Mathematics, has singled out a spreadsheet as an appropriate tool for doing mathematics in elementary school as early as in grades 3-5. Furthermore, students at that grade level are even expected to acquire ability of setting up a simple spreadsheet in their mathematical pursuits. Therefore, if we are to implement the Standards, a spreadsheet should become a friendly tool for classroom teachers across all grade levels. Consequently, the teachers' proficiency and comfort level with spreadsheets as cognitive tools would make it possible to incorporate a spreadsheet-enabled pedagogy into contemporary elementary mathematics classroom.
This web site offers several spreadsheet-based learning environments created by the author over the years. The goal of using these environments by elementary teachers may be twofold:
(i) to generate new problems and in doing so, to facilitate assessment through engaging students into solving closely related problems, and(ii) to explore mathematical ideas with students in different representational formats - numeric, graphic, iconic - that are available in a spreadsheet environment.
This would allow teacher candidates to employ spreadsheet-based technology in developing alternative assessment strategies and providing their future students with a variety of visually rich, interactive dynamic learning environments. Following is the list of such environments created in support of the undergraduate course EDUC 310 - Elementary Mathematics Methods and the graduate course GRED 565 - Elementary Mathematics Content and Methods.
Contents
Multiplication facts using color tiles
Census taker and farmer's daughters ).
Mr. Ruiz .
Multiplication with Fraction Tiles.
Stem-and-leaf plot and averages.
Have students use counters to solve the following problem. A pet store' owner sold only birds and cats. One day he asked his clerk to count how many animals there were in the store. The clerk told him he counted 18 legs. How many cats and birds might there have been? Could there be more than one combinations of animals in the store?
The problem suggests using counters as mediational means for trial and error strategies in mathematical problem solving at the early elementary level. Indeed, the use of counters in solving the PS problem is extremely relevant for reformed mathematics classroom with its emphasis on hands-on exploration, constructivism, reflective inquiry, and diversity of thinking. Also, the rich content of this problem enables elementary teachers to use with students at that grade level such strategies as pencil-and-paper drawing, dramatization, and computer-supported drawing ( using, for example, the Kid Pix software). Yet, the teachers can be given a cognitive computational tool, a spreadsheet, which enables one to generate several problems that differ in a numeric input and observe a resulting change both in numeric and graphic formats.
The following link leads to a spreadsheet environment (Figure 1) designed to support the investigation of the PS problem. By clicking at a slider located in the right bottom corner of the spreadsheet template, a teacher can find answers to questions that differ in the number of legs total. A teacher may also use this environment to assess students' understanding of even and odd numbers. For example, for the number 19 as the legs total among birds and cats, there would be no solutions displayed in the chart of this spreadsheet environment. Why is it so? How are the numbers 18 and 19 different in the context of the problem? Of course, an explanation deals with the impossibility of representing an odd number as a linear combination of even numbers.
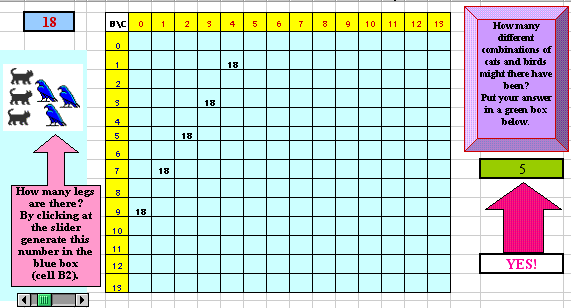 Figure 1. There are 5 different combinations of the animals.
Alternatively, the PS problem can be explored as a whole class discussion in a graphic environment. The bar graph shown in the graphic environment (Figure 2) shows the number of solutions for the total of 22 legs. By altering the number of legs total, kids can observe how a graph depends on this number and shows either several solutions or no solutions at all. In addition, kids can be encouraged to type in a number in an answer box (see the graphic environment) and get an immediate feedback from a computer regarding the correctness of their interpretation of graphic information.
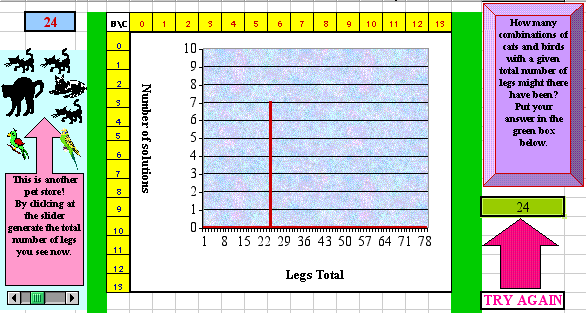 Figure 2. An incorrect interpretation of the graph.
One should take into account, however, that both numeric and graphic environments described above have some limitations. For example, 40 legs can be counted among 18 birds and 1 cat, but a chart would not show this combination as a solution because the number 18 exceeds the range 0-13. So, the question as to how many different combinations of animals might there have been relates to a given range of the animals.
Finally, students in grades 5-6 can be introduced to an animal store with species like crabs and starfish and asked to investigate this store. A new template (Figure 3) shows data in the range of 0-13 animals of the two types. Once again, the environment can stimulate a considerable amount of inquiry about a real-world situation. For example, at a pet store that cells starfish (5 legs) and Liphistiomorph spiders (10 legs) only, it is impossible to count the total of 128 legs. Why is it so? What is special about the triple (5, 10, 128) that does not allow for a non-zero solution? What is the smallest number greater than 128 for which there exists at least one combination of the species (starfish and Liphistiomorph spiders)? What about a relatively prime triple like (2, 3, 29)? In other words, can species with 2 and 3 legs make the total of 29 legs? Why or why not? The list of questions continues as students' curiosity arises.
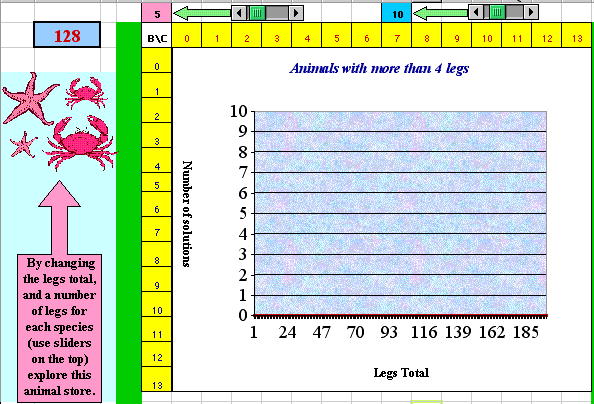
Figure 3. Starfish and Liphistiomorph spiders cannot make the total of 128 legs.
(Descriptions of spreadsheet programming of the above three environments will be available soon.)
*******************************************************************************************
Back to the Contents
*******************************************************************************************
Constructing multiplication facts using color tiles.
This classroom idea for grades 1-2 reads as follows:
Give students specified numbers of color tiles - for example, 18 tiles. Have them make as many rectangles as possible out of the tiles and record each rectangle on a piece of graph paper, noting the number of rows and columns of each rectangle, to find all the multiplication facts for the given number.
This classroom idea can be explored both with (electronic) manipulatives (Figure 4) and numerically (Figure 5) by using a spreadsheet. One can see two environments - the manipulative and the numeric - embedded into a workbook. The first environment, titled Pictures, shows how one can use 18 tiles for demonstration of all multiplication facts for this number. The second environment, titled Numbers, consists of an 18x18-multiplication table which shows all multiplication facts that the table can generate for that number. In such a way, the commutative property of multiplication can be demonstrated in two different environments.
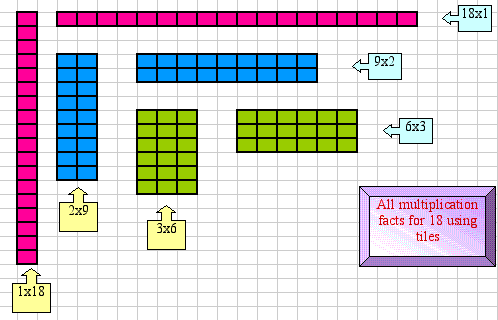
Figure 4. Using electronic manipulatives to demonstrate multiplication facts for number 18.
A common misinterpretation of this classroom idea by elementary pre-teachers is that not all 18 tiles have to be used in constructing a rectangle. Some pre-teachers may use 18 tiles to construct more than one rectangle; for example, they may use two tiles for the first rectangle, three tiles for the second rectangle, four tiles for the third rectangle, and nine tiles for the fourth rectangle. Such interpretation of the problem in which all rectangles involved have a unit width, leads to a different problem (with obvious mathematical depth) - the finding of all combination of whole numbers that add up to 18 (see CM, p. 25, performance indicator 1C which, in particular, may include this idea). This new problem can be explored by kids for a smaller number of tiles. A spreadsheet that shows all combinations of whole numbers that add up to 4 can be downloaded also. As the spreadsheet shows, the total number of such combinations is 16. In order to find out how 4 and 16 are related in this problem, one may try a similar, yet simpler, problem of finding all combinations of whole numbers that add up to 3 and then try to guess a general rule.
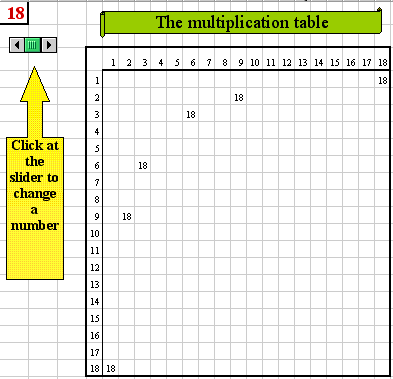
Figure 5. All multiplication facts for number 18 in numeric form.
*******************************************************************************************
Back to the Contents
*******************************************************************************************
Census taker and farmer's daughters.
Have students solve the following problem in groups and report to the class the strategy they used.
A census taker asked the farmer the ages of his three daughters. The farmer told him that the product of their ages is 72 and the sum of their ages is the house number. The census taker performed some computations and then looked at the house number. At this point, he told the farmer that he still could not tell the ages of the daughters. The farmer said, "I forgot to tell you that the oldest likes chocolate pudding." This helped the census taker and he now knew the ages of the three daughters. What are the ages of the three daughters? One can explore this problem in a spreadsheet environment and pose/solve his/her own similar problems.
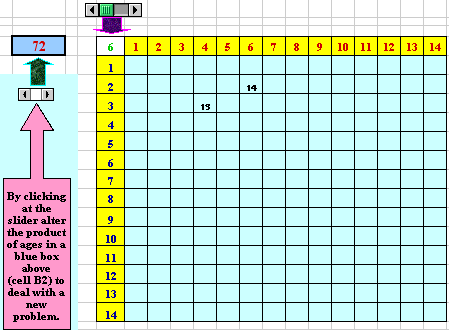 Figure 6. Two sets of 3 factors of 72 with different sums (13 and 14).
Note: A green number always stands for the age of the oldest daughter (if any).
*******************************************************************************************
Back to the Contents
*******************************************************************************************
This problem is borrowed from the New York State's Elementary School Test for Fall 1999. It reads as follows:
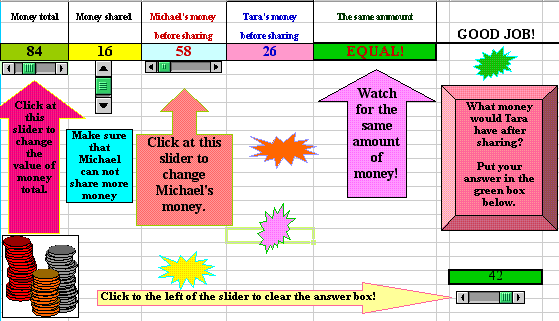
Michael has two quarters, two nickels, and two pennies, while Tara has a quarter, a nickel, and two dimes. Which coins could Michael give Tara so that they both have the same amount of money?
An interactive computational environment that can generate a solution to this and similar problems has been created on a spreadsheet template (Figure 7). You may download a spreadsheet that enables a user to alter several parameters of the problem, namely: the total amount of money that both kids have, the amount of money shared, and Michael's money total. Also, using the spreadsheet allows for an interactive feedback regarding a student's response to a question about the amount of Tara's money after sharing. In the case of a correct answer, the spreadsheet generates the message "Good Job!" and the message "Try Again" otherwise.
Figure 7. Numerical values shown above allow for different combinations of coins that the kids might have.
Following is an example of an extended problem generated with the help of the above environment.
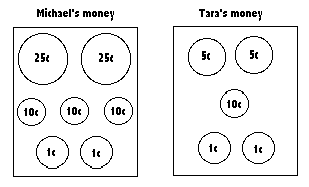
Michael's and Tara's money are pictured in Figure 8. Which coins should Michael and Tara give to each other (i.e., they may exchange coins) so that Michael would have three times as much money as Tara?
Figure 8. A combination that require exchange of the coins to satisfy the above condition.
*******************************************************************************************
Back to the Contents
*******************************************************************************************
NYSTPM-4, page T-10. This problem reads as follows:
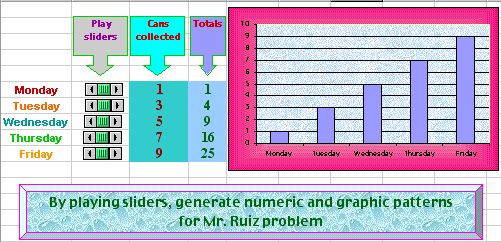
Mr. Ruiz promised to reward his class with animal stickers when the total number of cans reached 15. The bar graph (see the activity) shows the number of cans the class brought in each day. What day did Mr. Ruiz give the class the animal stickers? How many days did the students collect more than 5 cans?
Figure 9. Different representations of cans totals for each of the five days.
*******************************************************************************************
Back to the Contents
*******************************************************************************************
Example for grades 5-6.
Have students circle abundant numbers on a hundred board and describe the pattern on the hundred board. (Definition: An abundant number is a number such that the sum of its proper divisors is greater than the number itself. For example, the sum of the proper divisors of 12 [1+2+3+4+6=16] is greater than 12.) Have students write in their journal: Why does this work? Does it happen with all numbers? (Course Materials, p.86).
Figure 10.
*******************************************************************************************
Back to the Contents
*******************************************************************************************
Multiplication with Fraction Tiles.
This classroom idea for grades 5-6 relates to operations with mixed fractions and reads as follows.
It is interesting to have students explore multiplication with fraction tiles in terms of mixed numbers. In that form each factor has two parts: a whole part and a fraction part. The result is very similar to the tile method for multiplying two digit numbers. In the case of (2 1/4)x (3 2/3) the students have 2 1/4 horizontally in the area model and 3 2/3 vertically. Tiles created in a spreadsheet environment show that
(2 1/4)x(3 2/3) is (2x3)+(2x2/3)+(2/3x1/4)+(3x1/4).
Have students relate this to the distributive property.
Figure 11.
*******************************************************************************************
Back to the Contents
*******************************************************************************************
Stem-and-leaf plot and averages
This classroom idea for grades 5-6 relates to statistics and reads as follows.
Given a set of one-variable data, have students create a histogram. Ask students if they can find the mode, mean, and median from the histogram. Show the students how to display the same information in a stem-an-leaf plot. Put the histogram over the stem and leaf to show that they create the same graph. Ask students how they would find the mode, median and mean from the graph.
Figure 12.
*******************************************************************************************
Back to the Contents
*******************************************************************************************
Classroom idea 1B ([1], p. 77) for grades 5-6 related to probability reads as follows.
Jackie and Carolyn are going to play a spinner game. These are the rules:
When it is a player's turn, she spins both spinners. Then she adds the two numbers that the arrows point to. If the sum is odd (1, 3, 5, 7, 9, ....), Jackie wins, even if it was not her turn. If the sum is even (0, 2, 4, 6, 8, ...), Carolyn wins, even if it is not her turn. The numbers 3, 4, and 8 are equally likely on the first spinner. The numbers 0, 1, and 4 are likely on the second spinner.
Carolyn tries a test spin, first. She gets a 3 on the first spinner and a 0 on the second spinner. The sum of the two spinners is 3 and Jackie wins. Jackie says, "I like this game. I have a better chance to win it than you do." Carolyn says, "No, I have a better chance to win it than you do."
Use mathematics to explain which girl is correct.
One can download the "Is The Game Fair" environment and do a spreadsheet simulation of the "two spinner" game.

Figure 13. Charts with theoretical (top) and experimental (bottom) data for the "two spinner" game.
The use of the function RAND from the spreadsheet-based tool kit of available computing devices makes it possible to model the spinner game on a spreadsheet. That is, at the push of the button F9 on a key board, the spreadsheet randomly chooses a number on the first spinner, another number on the second spinner and decides about the parity of their sum (see the bottom chart of Figure 6). This makes it possible to conduct a computer simulation of the game and understand that the more one spins, the more is the number of even outcomes. Theoretically, the probabilities for Jackie and Carolyn to win are 4/9 and 5/9 respectively (see the top chart of Figure 6). In a real experiment, however, a relative frequency (experimental probability) of being a winner for each girl would be different from the above numbers. Yet, as the number of experiments grows large, the differences between corresponding fractions (theoretical and experimental) would become less and less significant. This profound relationship between theoretical and experimental probability can be introduced to 5- or/and 6-graders when teaching the key idea 6 - Uncertainty - of the NYS Mathematics Core Curriculum.
****************************************************************************************
Back to the Contents
*******************************************************************************************
These environments are created to support elementary teachers with computer-generated drill and practice exercises on addition, subtraction, and multiplication that allow for the variation of the level of complexity of a task. For example, a worksheet on addition may contain facts with sums not greater than 20, and a worksheet on subtraction may contain facts involving numbers less than 10. Such worksheets are commonly known as Mad Minutes.
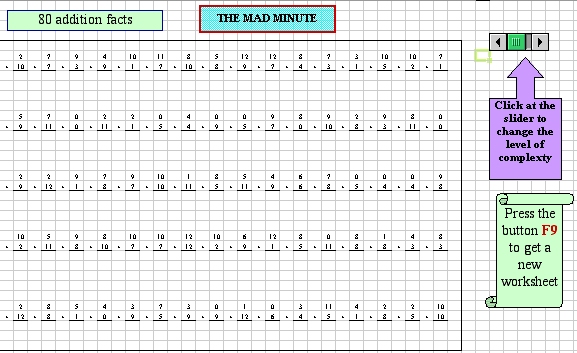
Figure 14. A template with 80 addition facts controlled by the slider and F9 button on a Mac keyboard.
Open one of the files which contains addition and subtraction and multiplication environments. Then download the Excel file on a desktop of your computer or on a floppy disk. Open a worksheet that contains one of the environments. Upon the push of the button F9 (on a Mac keyboard) a spreadsheet generates a new Mad Minute worksheet. In order to change the level of complexity of a worksheet, click at the slider located to the right of the worksheet. Then print out the worksheet (AutoShapes and a slider are not included into a printed area and will not appear on your worksheet). In such a way, elementary teachers can accommodate students with a variety of drill and practice worksheets by changing the level of the complexity of a Mad Minute environment accordingly. In addition, there is a spreadsheet-based addition worksheet that kids can use working on a computer. Please download this environment and put it to work.
*******************************************************************************************
Back to the Contents
******************************************************************************************
This environment enables a user to find a prime factorization of numbers in the range of prime factors and their exponents up to 1543 and 13 respectively. For instance, this environment can correctly handle the number 12640256 (=1543*2^13).

Figure 15. Each of the three prime factors contributes to 345 with a unit exponent (345=3*5*23).
*******************************************************************************************
Back to the Contents
*******************************************************************************************
Electronic Manipulative Environment Fraction Circles.
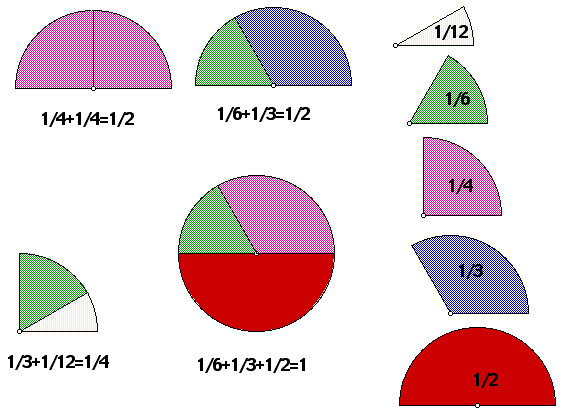
The Mathematics Core Curriculum mentioned fraction models as appropriate manipulative tools to be used with the students in the elementary school. One such model is the so called Fraction Circles. Following is a link to The Geometer's Sketchpad scripts of fraction circles that enables one to construct electronic fraction circles for different purposes. Open the Fraction Circles environment and learn how to construct fraction circles using the scripts.
Figure 16. Ordering and adding unit fractions.
*******************************************************************************************
Back to the Contents
*******************************************************************************************
